
A lot of us are in lockdown at the moment, and I am sure many are the same as me, and we are looking for fun (often random) side projects to work on.
One of mine recently, was to find out if I could find a visually appealing way to display my internet throughput over my home internet connection.
Background
At home, I use a Mikrotik router as my primary gateway. The big advantage of this is that Mikrotik’s use RouterOS, which has an API which can be used to query the device for information and data, as well as issue several commands to modify the operation of the device, depending on your needs. This was important for me, as I needed a way to be able to get throughput and usage statistics from my gateway device.
Getting the data
Upon some further research, I found some spectacular code has already been written by nshttpd and others over here: https://github.com/nshttpd/mikrotik-exporter - essentially this is a mikrotik exporter, that collects information from RouterOS and ships these metric points to Prometheus.
Finding this great exporter, meant that a lot of my work was already done for me, and I didn’t need to spend much time writing and exporting the metrics myself. Many thanks to the contributors and developers of that project!
Putting it all together
Once I had found this exporter, I simply packaged it up into a docker container for easy execution, and created a Docker stack with the exporter, Prometheus, Grafana and Traefik, so that I could have a self contained “monitoring” stack for my home internet. I created this and started it up on one of the machines in my home, so that the collector could run for a while and generate some data.
Once I had everything up and running, I needed a dashboard to visualise this data in Grafana. Luckily I found one that had already been somewhat created, over here: https://grafana.com/grafana/dashboards/10950. I made some updates to this in order to support my specific set up and the data available from my specific device.
Final Results
What does this all result in? Well…

Additionally I am also able to see (probably the most useful graph) my live internet traffic flowing through my gateway. I can see exactly when my link is under heavy load, and when it is quiet, especially useful when things seem a bit slow, and you need to find out which pesky device has decided it’s time for a big update.
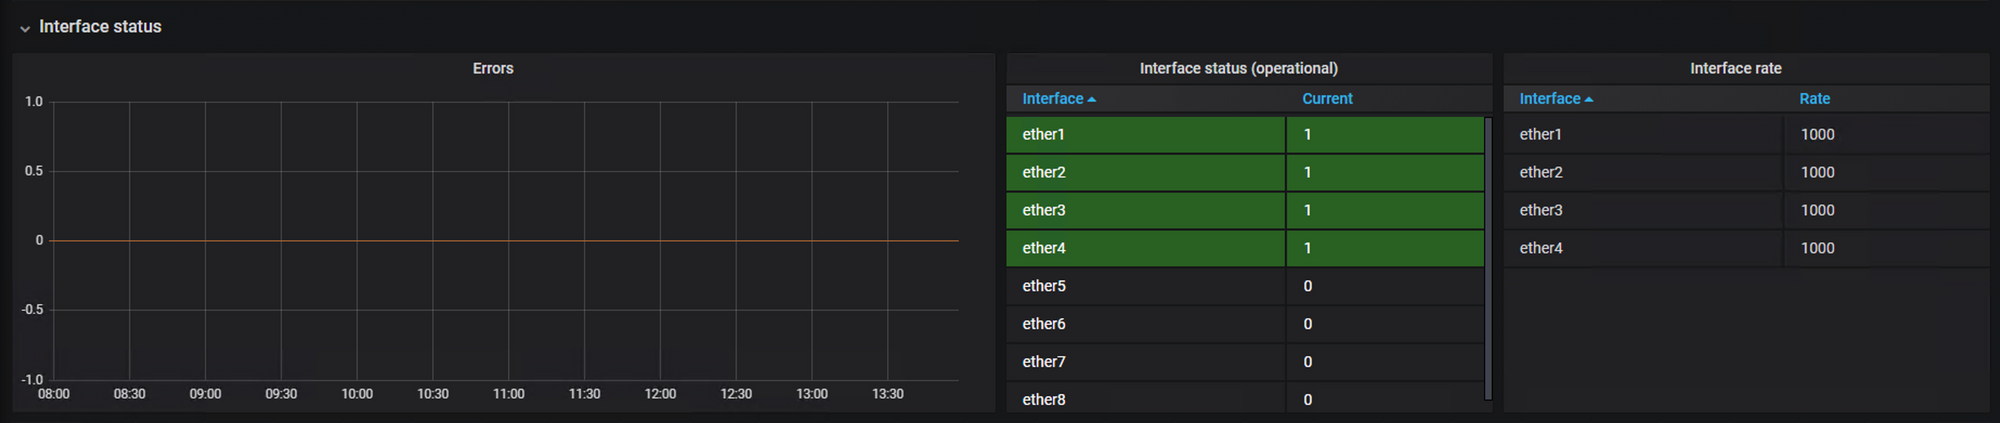
Below, I am also able to see any link errors, which interfaces on the device are running, and what speed the links are running at, in case one of my network cables or ports goes bad, I can instantly tell where the issue might be. This was epecially useful when I had a cable running at 100mb instead of 1gb, and my internet throughput dropped to 100MBps.
Conclusion
In conclusion, this was a fairly fun project, resulting in some useful information about my home set up, but mainly just for fun and interest to see what can easily be done, in a very short period of time, using a lot of projects that already exist, like the Mikrotik Exporter, Grafana, Prometheus, Traefik and others.
Let me know if you’d be interested in seeing more info behind the scenes on how I configured everything here!
-Devin